3D & Digital Twin202546.2044° N, 6.1432° E
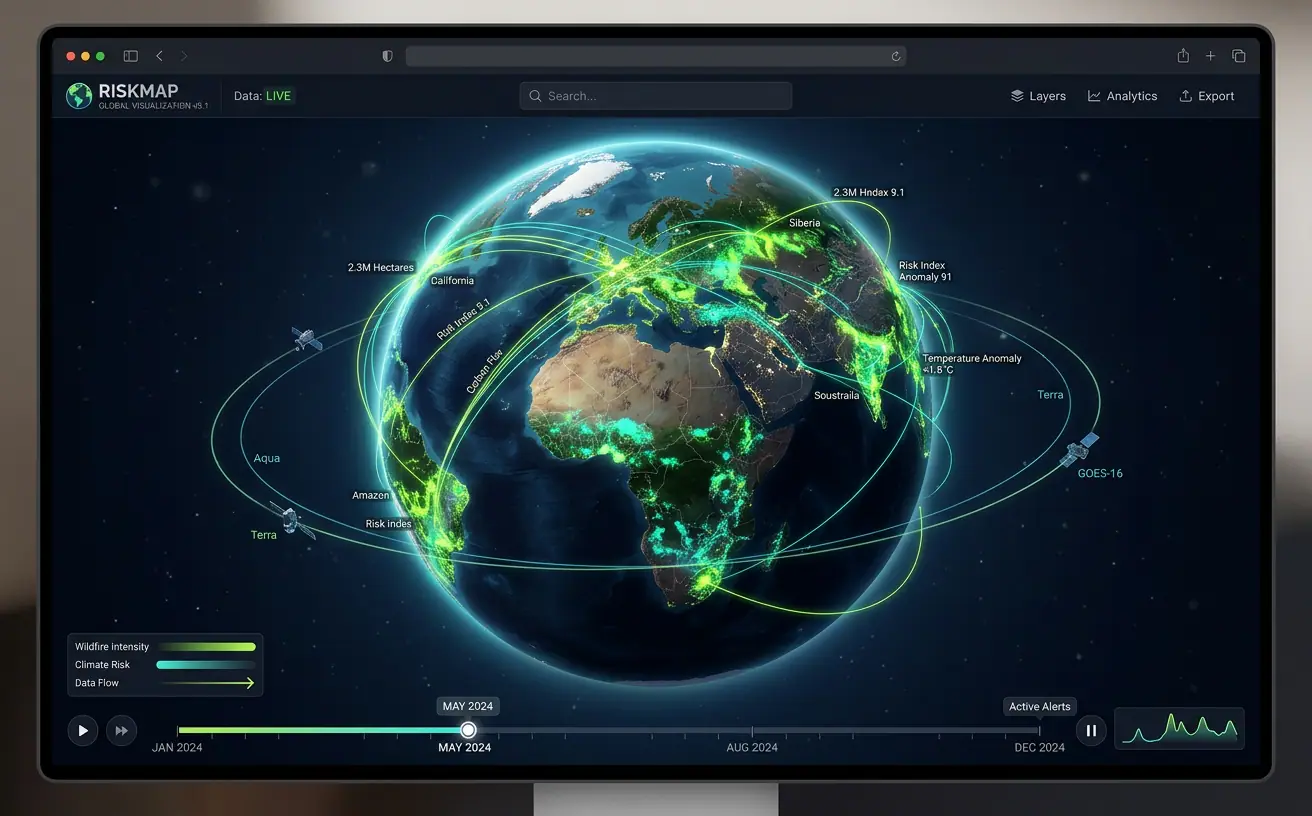
Global Climate Risk Digital Earth
An interactive 3D globe fusing satellite, weather and wildfire feeds into time-animated risk layers spanning 40 years.
- Role
- Full-Stack GIS Developer
- Client
- Climate research consortium
- Timeline
- 9 months
- Platform
- Web application
- 40 yrsof time-series data
- 30TBarchive streamed on demand
- 2sto first globe render
Overview
The brief
Researchers and insurers wanted to explore decades of climate hazard data without downloading terabytes of rasters. I built a browser-based digital earth that streams multi-dimensional data and animates it through time on a 3D globe.
Challenge
What made it hard
The archive was tens of terabytes of NetCDF in mixed projections. Users needed to scrub through time smoothly and drill from planet scale down to a single county.
Solution
How I built it
I converted the archive into chunked Zarr and Cloud-Optimized GeoTIFFs indexed in a STAC catalog, then wrote custom CesiumJS and Three.js shaders that sample tiles on the GPU and interpolate between time steps for smooth playback.
Key features
- Time-animated hazard layers with smooth GPU interpolation
- Wildfire, flood, heat and drought risk indices
- Region drill-down with on-the-fly zonal statistics
- Shareable story links that capture camera, time and layers
- STAC-powered catalog for discovering datasets
Tech stack
- CesiumJS
- Three.js
- Zarr / COG
- Python
- STAC
- WebGL
See it running
Open the live app in your browser.