Real-Time202640.2206° N, 74.7597° W
GeoMetrikks — Real-Time Geospatial Traffic Analytics Platform
A self-hosted geospatial analytics platform that turns reverse-proxy access logs into live world maps, traffic analytics and CrowdSec-backed security insight.
- Role
- Full-Stack GIS Engineer
- Client
- Self-hosted / open source
- Timeline
- Ongoing
- Platform
- Web application
- 5log sources supported
- 3live map views
- 2CPU architectures (amd64 & arm64)
Overview
The brief
GeoMetrikks is a real-time geospatial traffic analytics platform that transforms web server access logs into interactive maps and actionable insights. It provides live geographic visualization, visitor tracking, traffic analytics, IP investigation and CrowdSec security integration, all self-hosted with Docker.
Challenge
What made it hard
Reverse-proxy access logs are plain text spread across servers. Seeing where traffic comes from, which visitors are hostile and how a site is performing meant grepping raw lines, with no geographic picture and no link to ban decisions.
Solution
How I built it
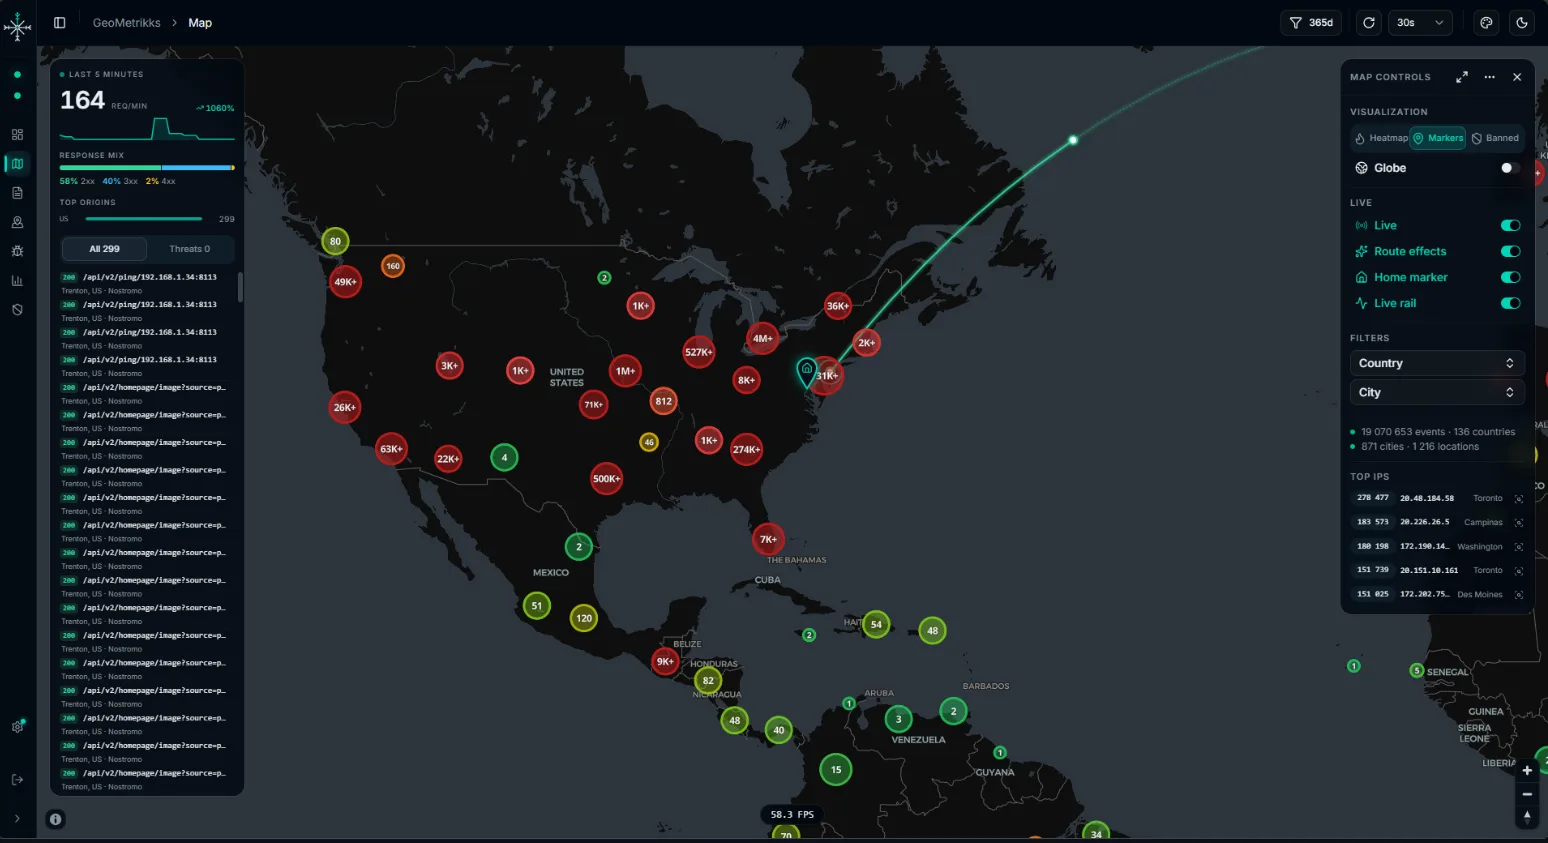
A Litestar API on Python 3.13 ingests Nginx, Traefik, Caddy and Loki logs, enriches every request with MaxMind GeoLite2 location and ASN data, and stores it in PostgreSQL with PostGIS and TimescaleDB. WebSockets push new requests to a React and MapLibre GL JS frontend within seconds, and the CrowdSec Local API drives ban status and ban/unban controls. Agent mode lets several proxies feed one shared map.
Core features
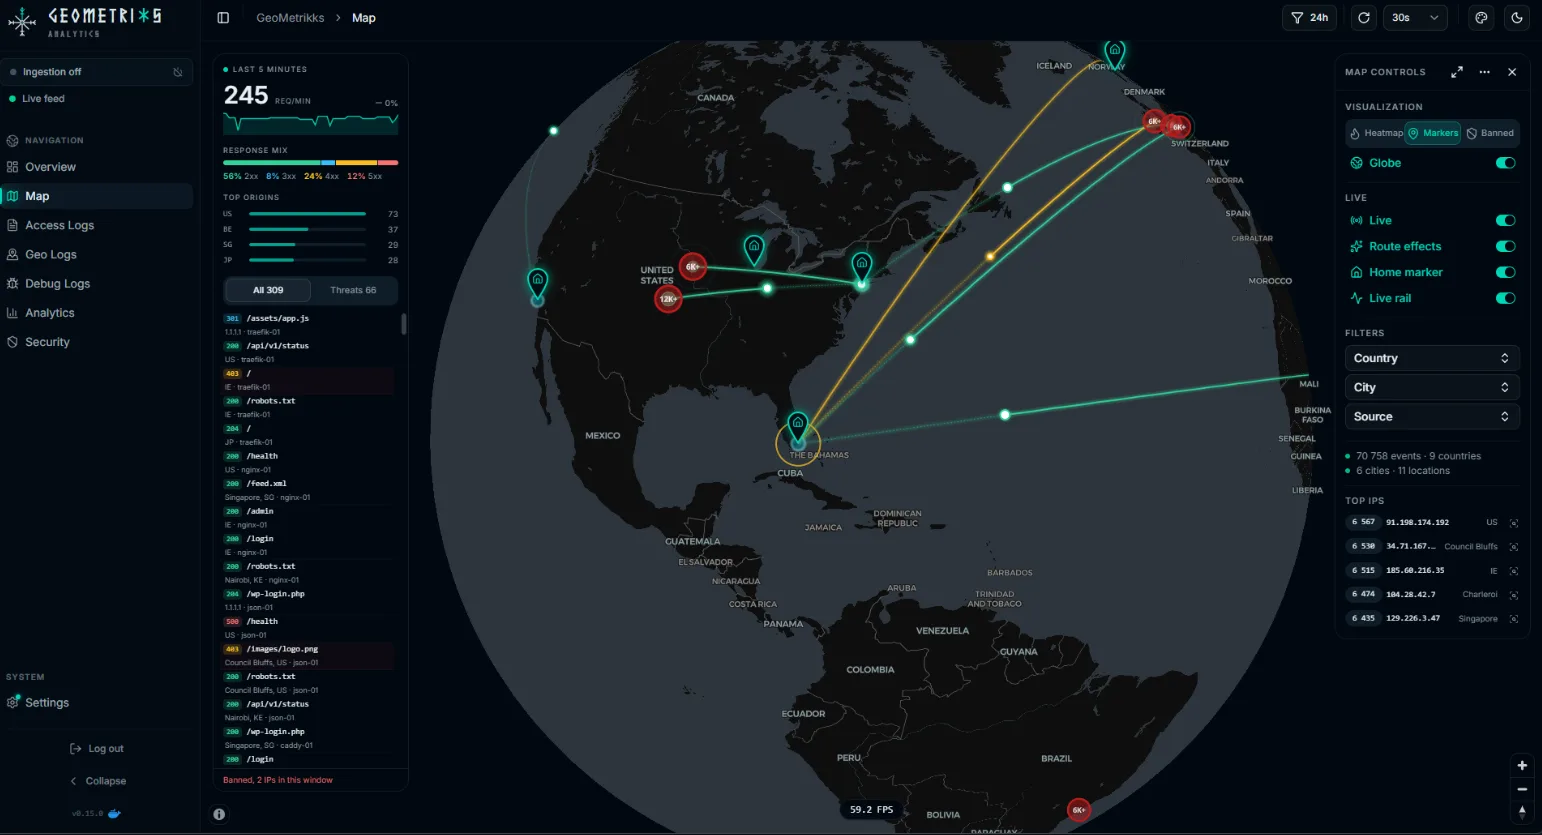
Live globe & route effectsRequests arc in real time from visitor locations to your servers, with marker, heatmap and banned-IP views. 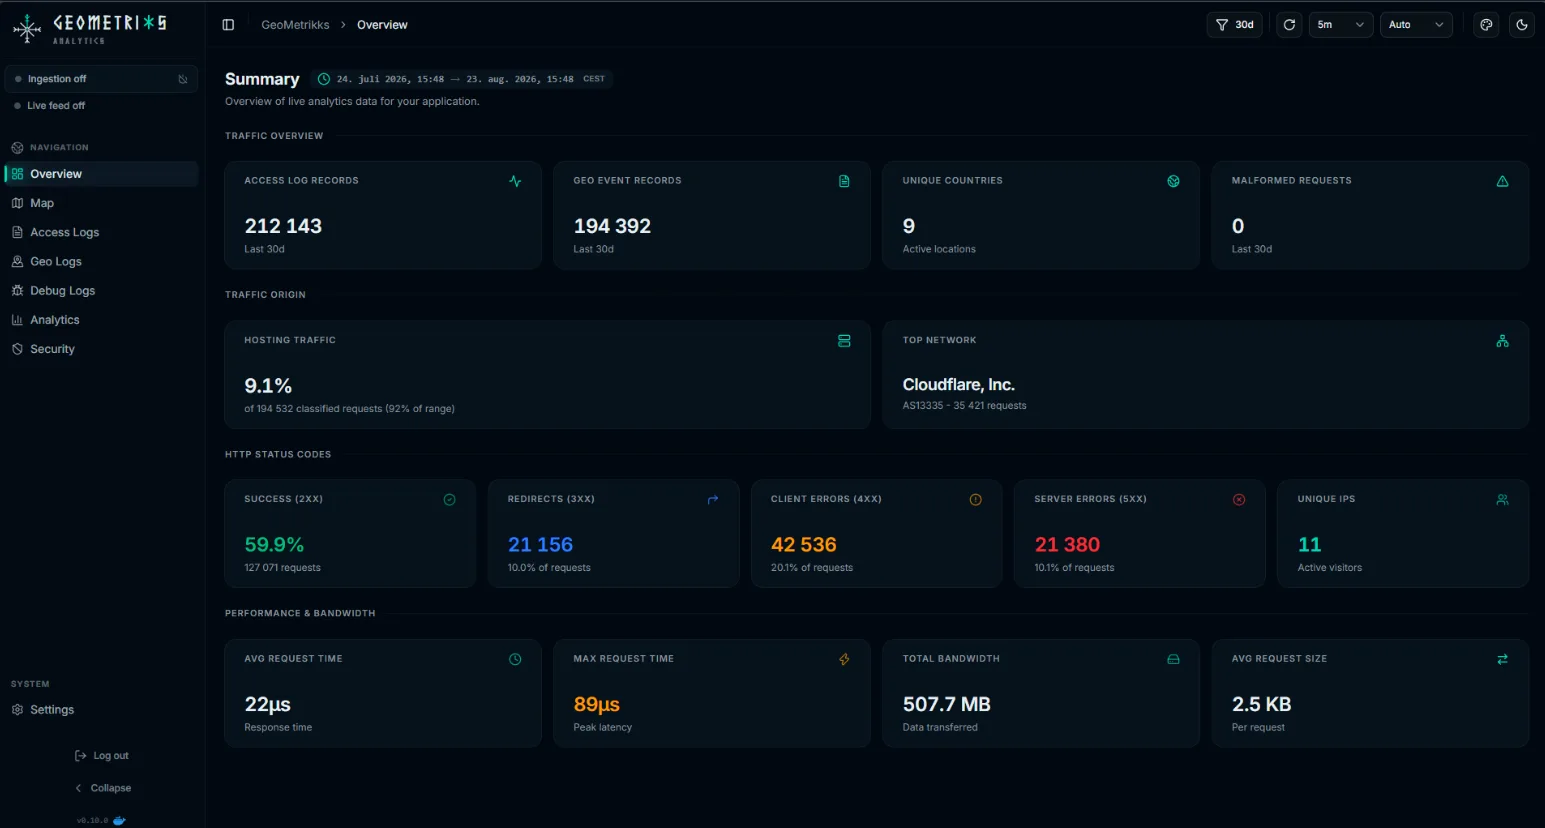
Traffic overviewRequests, countries, status codes, top networks and bandwidth for any time range at a glance. 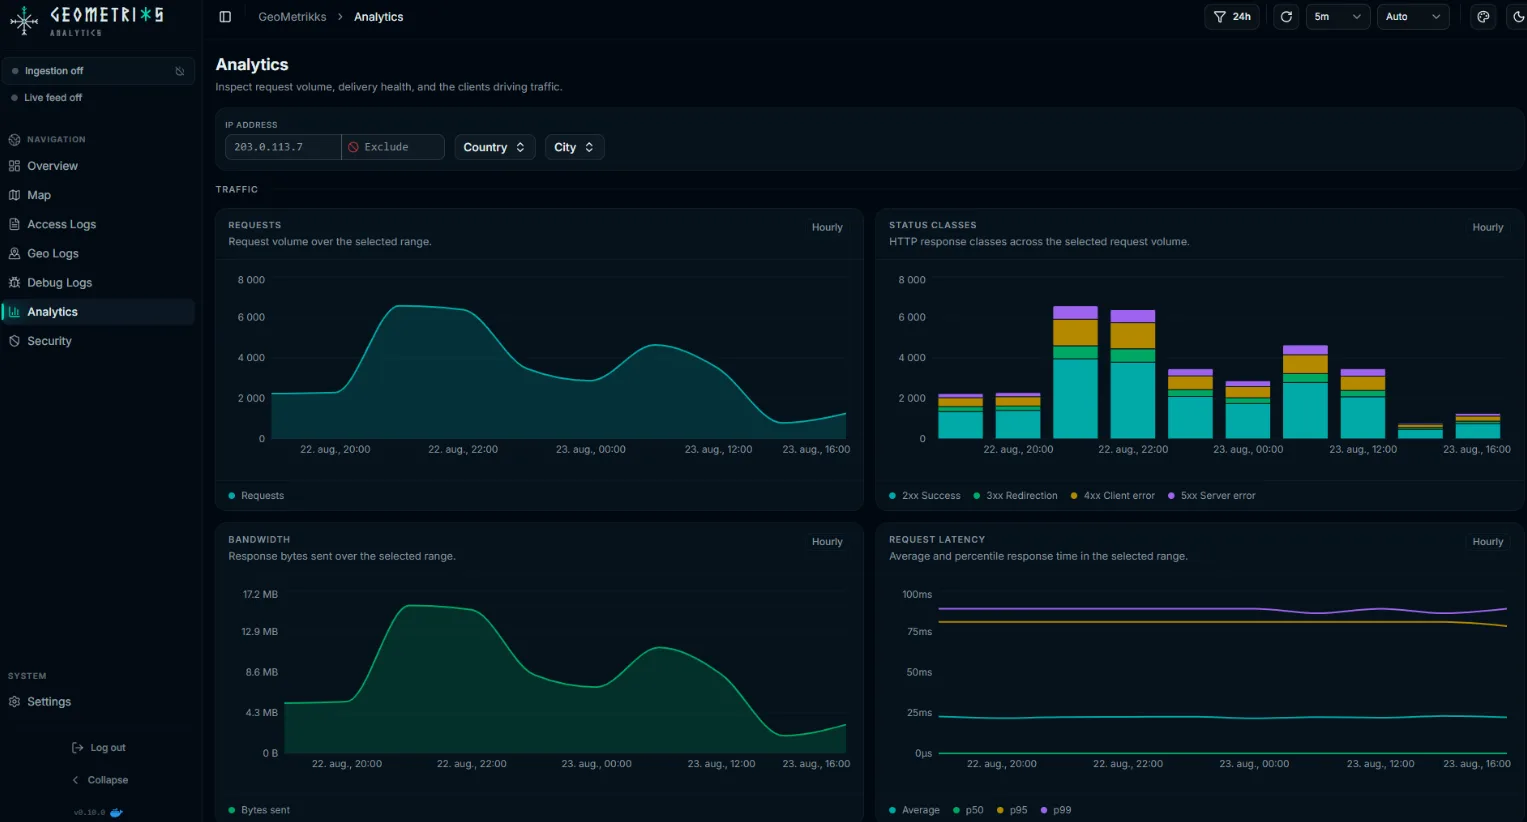
Traffic analyticsHourly request volume, status classes, bandwidth and p50/p95/p99 latency, filterable by IP, country and city.
Key features
- Live world map with markers, clusters or heatmap, on a flat map or globe
- CrowdSec banned-IP view and IP inspector with ban and unban controls
- Overview and analytics for status codes, latency percentiles, bandwidth and ASNs
- Searchable access logs with live tail, plus geo logs by country and city
- Batch import of rotated, gzipped or Nginx Proxy Manager logs
- Agent mode so multiple servers feed one shared map
Tech stack
- Python
- Litestar
- React
- MapLibre GL
- PostGIS
- TimescaleDB
- WebSockets
- CrowdSec
- Docker
See it running
Open the live app in your browser.