All projects10 / 10
Real-Time20221.2644° N, 103.8200° E
Maritime Vessel Tracking & Port Congestion
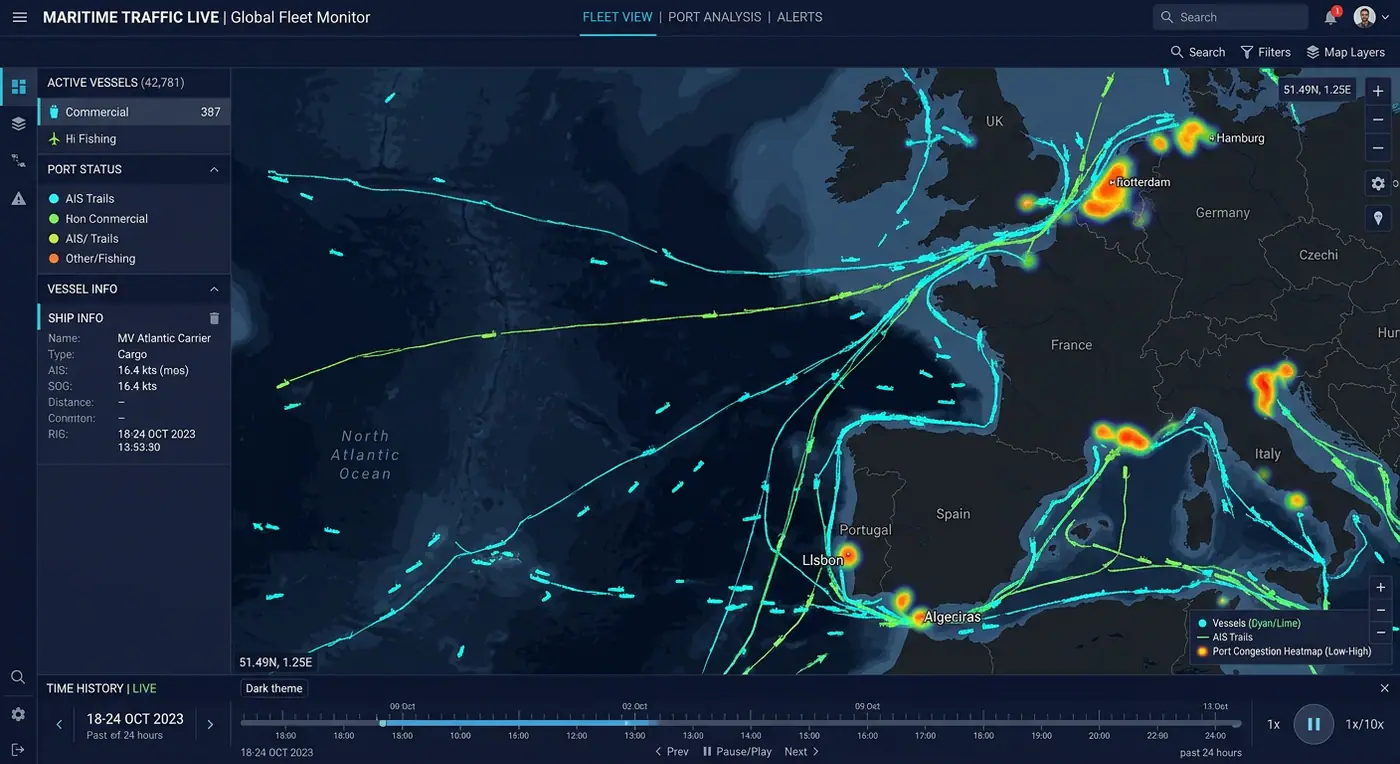
Live AIS vessel positions, trajectory trails and congestion heatmaps for one of the busiest shipping lanes.
- Role
- Real-Time GIS Developer
- Client
- Port authority
- Timeline
- 6 months
- Platform
- Web application
- 8MAIS messages per day
- 6hcongestion forecast horizon
- 19%shorter average wait
Overview
The brief
Port operators needed to anticipate congestion instead of reacting to it. I built a live maritime picture combining AIS feeds with berth schedules and historical patterns.
Challenge
What made it hard
Millions of AIS messages per day, noisy positions, and a need to show both live state and long-term patterns.
Solution
How I built it
A streaming pipeline cleans and deduplicates AIS messages, stores trajectories in TimescaleDB with PostGIS, and renders trips and heatmaps with deck.gl. A simple model predicts arrival queues from historical patterns.
Key features
- Live AIS positions with vessel details
- Animated trajectory trails and replay
- Port congestion heatmaps and queue predictions
- Anchorage and restricted-zone alerts
- Daily traffic reports
Tech stack
- deck.gl
- TimescaleDB
- PostGIS
- Node.js
- AIS
See it running
Open the live app in your browser.