Spatial Analytics202341.8781° N, 87.6298° W
Retail Site Selection Analytics
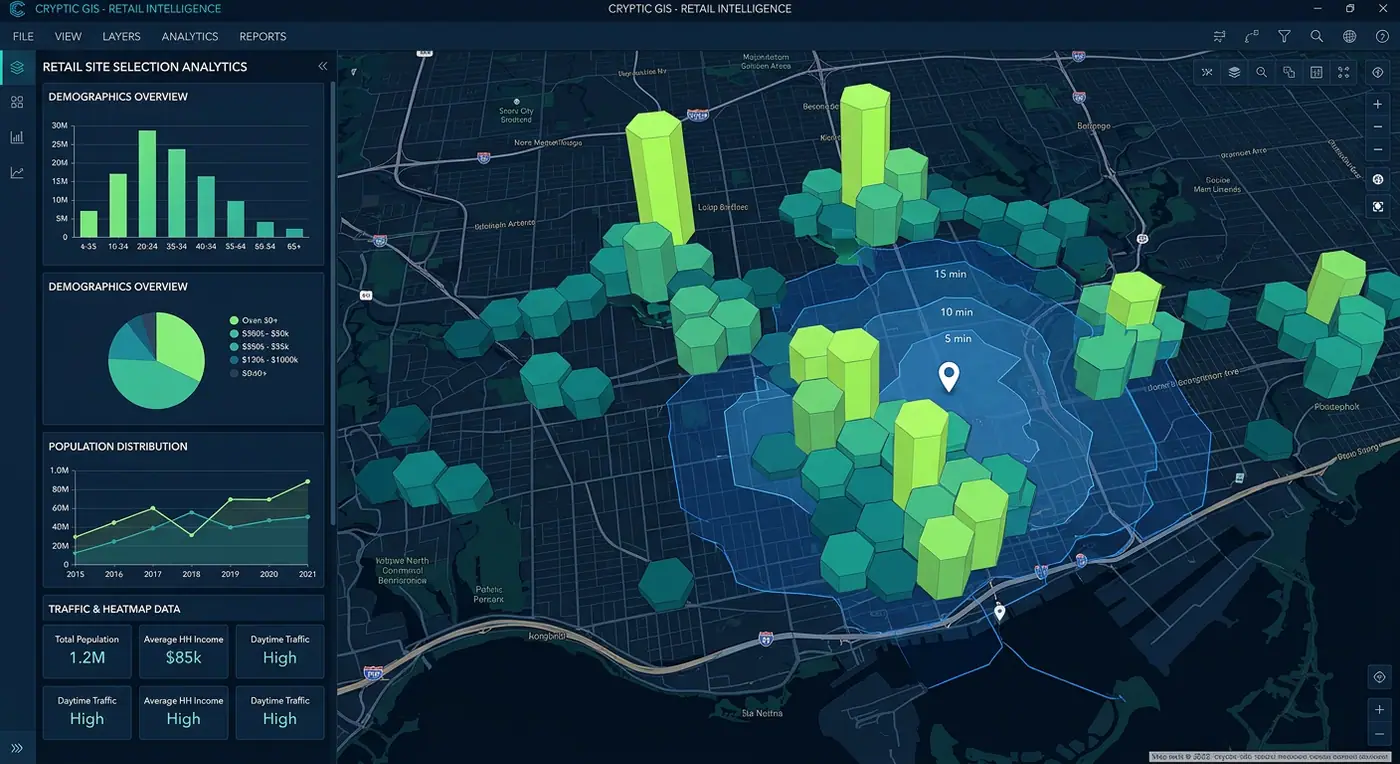
Drive-time isochrones, H3 hexagon demographics and cannibalization scoring to pick the next best store location.
- Role
- Spatial Analytics Engineer
- Client
- Retail expansion team
- Timeline
- 5 months
- Platform
- Web application
- 38new stores opened
- 17%higher first-year revenue
- 2sper site analysis
Overview
The brief
A growing retail chain was choosing new locations by gut feel. I built an analytics tool that scores any candidate site using demographics, competition and travel time.
Challenge
What made it hard
Combining census data, mobile footfall and competitor locations at a consistent resolution, and returning results interactively.
Solution
How I built it
All inputs are aggregated into an H3 hexagon grid in PostGIS. Drive-time isochrones come from a self-hosted routing engine, and deck.gl renders 3D hexagon layers with instant re-scoring as users drag a candidate pin.
Key features
- Drag-and-drop candidate sites with instant scoring
- Drive-time and walk-time isochrones
- 3D H3 hexagon demographic layers
- Cannibalization analysis against existing stores
- Exportable site reports for executives
Tech stack
- H3
- deck.gl
- PostGIS
- Valhalla
- React
See it running
Open the live app in your browser.